This article series aims at evaluating ETFs (exchange-traded funds) regarding the relative past performance of their strategies and metrics of their current portfolios. Reviews with updated data are posted when necessary.
DBEF strategy
Xtrackers MSCI EAFE Hedged Equity ETF (NYSEARCA:DBEF) started investing operations on 06/09/2011 and tracks the MSCI EAFE US Dollar Hedged Index. It holds 753 stocks, 14 stock index futures, and 12 short positions in foreign currencies, to offset the currency risk on stock holdings. The fund has a total expense ratio of 0.36%, a 12-month distribution yield of 0.66% and a 30-day SEC yield of 2.91%. Distributions are paid semi-annually.
As described by MSCI, the underlying index
“is designed to represent the performance of large and mid-cap securities across 21 developed markets, including countries in Europe, Australasia and the Far East, excluding the U.S. and Canada.“
The index also aims at neutralizing exposure to fluctuations between foreign currencies and the U.S. dollar. The portfolio turnover rate in the most recent fiscal year was 19%.
The idea of a currency hedge is that if Japanese stocks in the portfolio gain +10% in JPY (for example), this part of the fund gains +10% in USD, whatever the Yen does. The currency hedge adds some complexity to a fund’s behavior. If the US dollar becomes stronger relative to the Euro and the Japanese Yen (the heaviest currencies in the portfolio), then the hedge brings positive excess return. However, if the US dollar goes down, the hedge is a drag because DBEF is long USD against the local currencies of the companies held in the portfolio. If you have a doubt about the strength of the dollar, or if you seek diversification with plain exposure to foreign economies, then you’d better choose a non-hedged fund. There is another level of risk related to currencies, not covered by the fund’s currency hedge. A stronger dollar may be beneficial to a foreign company’s sales because their products and services become cheaper in USD, and it may also be detrimental when providers or creditors must be paid in USD.
Portfolio
Almost 90% of DBEF’s asset value is invested in large and mega-cap companies. Europe is the heaviest region (63.3% of assets), and Japan is the heaviest country (21.4%). The next chart plots the countries weighing more than 1%, representing 91.2% of asset value in aggregate. Hong Kong weighs 1.7%, so direct exposure to geopolitical risks related to China is very low.
Country allocation (chart: author: data: Xtrackers)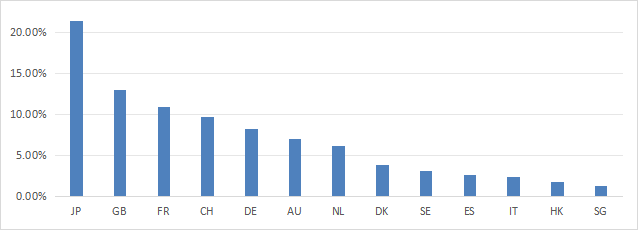
The fund is well-diversified across sectors: none weighs more than 20%. The heaviest ones are financials (18.9% of assets), industrials (15.5%) and healthcare (12.8%).
Sector Breakdown (chart: author: data: WisdomTree.)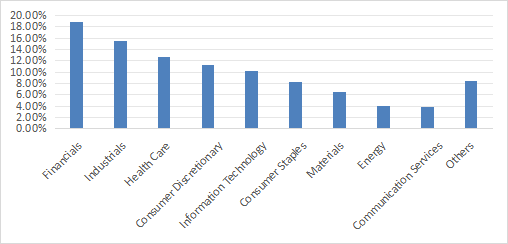
The fund is well-diversified across holdings as well. The top 10 names, listed below, represent only 15.4% of asset value. The heaviest one weighs 2.69%, so risks related to individual companies are low.
|
Name |
Weight % |
ISIN |
Country |
Sector |
|
Novo-Nordisk B |
2.69 |
DK0062498333 |
DK |
Health Care |
|
ASML Holding NV |
2.36 |
NL0010273215 |
NL |
Information Technology |
|
Nestle SA-Reg |
1.64 |
CH0038863350 |
CH |
Consumer Staples |
|
AstraZeneca PLC |
1.42 |
GB0009895292 |
GB |
Health Care |
|
Shell PLC |
1.32 |
GB00BP6MXD84 |
NL |
Energy |
|
LVMH Moet Hennessy Louis Vuitton |
1.25 |
FR0000121014 |
FR |
Consumer Discretionary |
|
Novartis AG-Reg |
1.23 |
CH0012005267 |
CH |
Health Care |
|
Toyota Motor Corp |
1.21 |
JP3633400001 |
JP |
Consumer Discretionary |
|
SAP SE |
1.16 |
DE0007164600 |
DE |
Information Technology |
|
Roche Holding AG-Genusschein |
1.16 |
CH0012032048 |
CH |
Health Care |
Fundamentals
The next table compares the aggregate fundamental metrics of DBEF and a U.S. large cap benchmark: the S&P 500 index (SP500), represented by SPDR S&P 500 ETF Trust (SPY). These metrics are calculated from equity holdings, currency positions don’t impact them. These metrics are the same for a non-hedged fund based on the same index, like iShares MSCI EAFE ETF (EFA).
DBEF looks significantly cheaper than SPY based on valuation ratios and has similar growth rates, except for a lower cash flow growth. However, these metrics must be interpreted with caution. Indeed, they are influenced by the sector breakdown (in particular, a higher weight in financials lowers valuation ratios) and historical country discounts.
|
DBEF |
SPY |
|
|
P/E TTM |
15.67 |
25.7 |
|
Price/Book |
1.84 |
4.46 |
|
Price/Sales |
1.48 |
2.91 |
|
Price/Cash Flow |
10.06 |
17.49 |
|
Earnings growth |
21.46% |
22.84% |
|
Sales growth % |
8.45% |
8.81% |
|
Cash flow growth % |
4.81% |
8.95% |
Data source: Fidelity.
Competitors
The next table compares the characteristics of DBEF and four popular currency-hedged ETFs:
- iShares Currency Hedged MSCI EAFE ETF (HEFA).
- WisdomTree International Hedged Quality Dividend Growth Fund ETF (IHDG).
- Franklin International Low Volatility High Dividend Index ETF (LVHI)
- IQ FTSE International Equity Currency Neutral ETF (HFXI).
|
DBEF |
HEFA |
IHDG |
LVHI |
HFXI |
|
|
Inception |
6/9/2011 |
1/31/2014 |
5/7/2014 |
7/27/2016 |
7/22/2015 |
|
Expense Ratio |
0.36% |
0.35% |
0.58% |
0.40% |
0.20% |
|
AUM |
$6.01B |
$6.49B |
$2.68B |
$1.02B |
$632.46M |
|
Avg Daily Volume |
$26.73M |
$55.16M |
$14.15M |
$7.04M |
$4.39M |
|
Holdings |
803 |
785 |
259 |
156 |
808 |
|
Top 10 |
14.95% |
15.75% |
34.89% |
25.70% |
14.17% |
|
Turnover |
19.00% |
15.00% |
86.00% |
64.00% |
14.00% |
|
Dividend Yield TTM |
0.66% |
2.69% |
1.66% |
6.83% |
2.52% |
|
4 Year Avg Yield |
6.07% |
8.05% |
4.88% |
5.81% |
3.02% |
|
Div. Growth 5 Yr CAGR |
-26.70% |
1.76% |
47.08% |
3.02% |
-0.42% |
DBEF is the oldest fund of this group, and it is ranked #2 in size (assets under management) and liquidity (dollar volume). It is behind HEFA in 4-year average yield and has the worst 5-year dividend growth. However, distributions may include hedging gains, which makes metrics based on distributions quite unreliable. As plotted on the next chart, the 2022 distribution was an outlier, skewing the averages.
DBEF distribution history (Seeking Alpha)
The next chart plots total returns, starting on 7/27/2015 to match all inception dates. DBEF comes in third position, behind IHDG, and almost tied with HEFA. The underlying indexes of DBEF and HEFA are almost identical (MSCI EAFE US Dollar Hedged Index vs. MSCI EAFE 100% Hedged to USD Index), which explains why their paths are so close.
DBEF vs. competitors since 7/27/2015 (Seeking Alpha)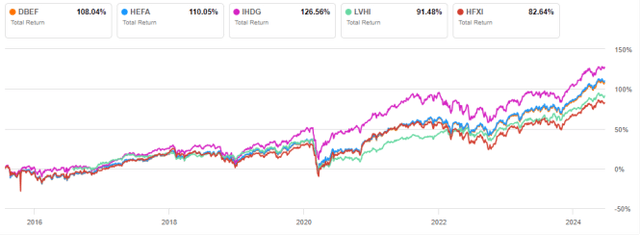
DBEF and HEFA are leading over the last 12 months:
DBEF vs. competitors, 12-month return (Seeking Alpha)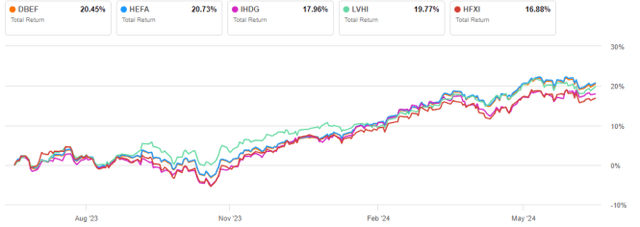
It makes little sense to compare DBEF with non-hedged ETFs. The last 10 years have been characterized by a dollar bull market: the US Dollar Index (DXY) has gained about 31% since 2014. It is a large bias when comparing hedged and non-hedged funds. Hedging gains may not be reproduced in the future.
Dollar index futures in monthly bars (Finviz)
The chart below compares DBEF with its non-hedged underlying index, represented by EFA.
DBEF vs. EFA, since inception (Seeking Alpha)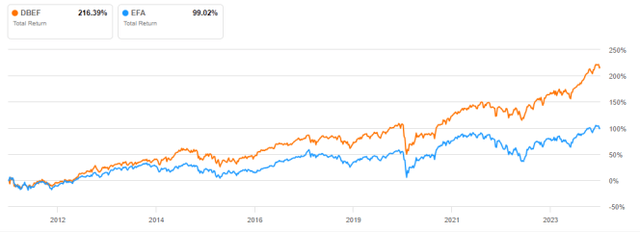
Takeaway
Xtrackers MSCI EAFE Hedged Equity ETF is a large-cap ETF investing in developed markets excluding the US and Canada. DBEF is well diversified across countries, sectors and holdings. The currency hedge aims at projecting the performance measured in local currencies to a performance in the dollar. It is supposed to offset the currency risk for USD-based investors.
DBEF embeds two bullish bets, on an equity index and the USD. Investors who are agnostic about the future USD trend or who seek plain exposure to foreign economies would likely prefer a non-hedged fund like EFA over Xtrackers MSCI EAFE Hedged Equity ETF.
Read the full article here





Leave a Reply