Introduction
Occasionally, the signs of stock bubbles come from unexpected places. Corning Incorporated (NYSE:GLW), for example, isn’t a particularly glamorous or exciting business. It isn’t new, and its long-term returns haven’t been great.
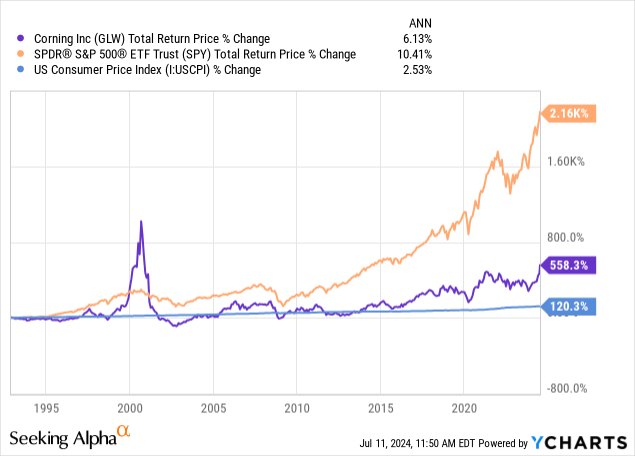
Over the past 30 years, the SPDR® S&P 500 ETF Trust (SPY) has outperformed GLW by about 4-fold. Real annual total returns for GLW have only been about 3.70%. However, despite GLW’s mostly underwhelming performance, we do see that the stock is not a stranger to bubbles. Around the year 2000, GLW experienced a massive bubble (the only time it has outperformed the S&P 500 index) that it has yet to recover from. GLW has started to show signs that the stock price is being driven by two common bubble dynamics, even if it’s not yet in a bubble as big as the one in 2000.
The first of those dynamics is that to the degree the stock is trading on fundamentals, they are short-term forward-looking earnings estimates rather than long-term historical earnings trends. The second is that the majority of the stock price movement is being driven by narratives rather than numbers at all. The recent stock price bounce is essentially about stories of the future rather than results of the past.
Narratives Versus Numbers
Part of the current narrative around Corning’s recent stock price jump this year has been around their production of fiber components for data centers, which in turn is expected to have higher demand from AI. But that narrative has yet to produce any real numbers improvement Corning.
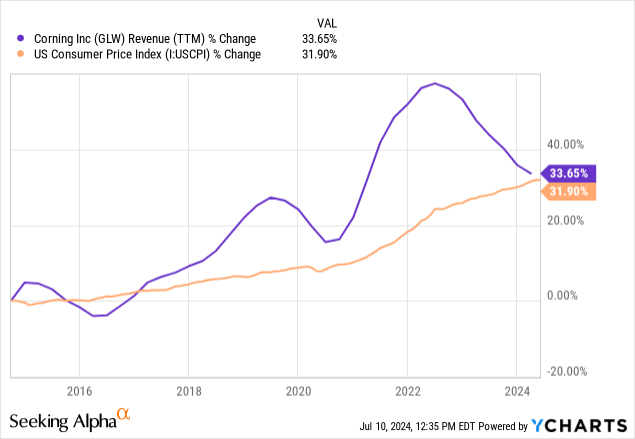
Over the past 10 years, Corning’s revenues have essentially matched inflation. So for a decade, there has been no real revenue growth and the most recent trend is down, not up.
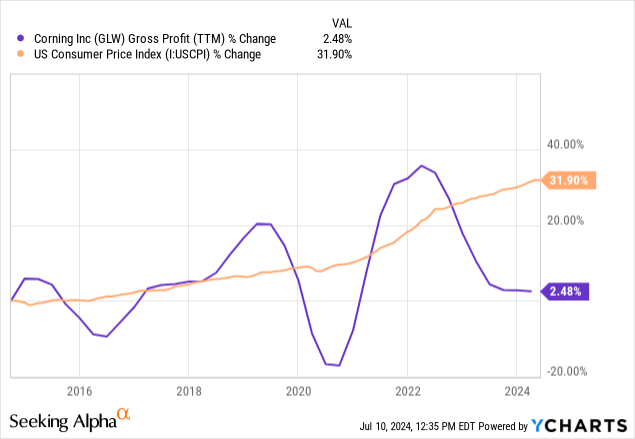
Gross profit growth during the past decade has been flat in absolute terms and significantly negative in real terms.
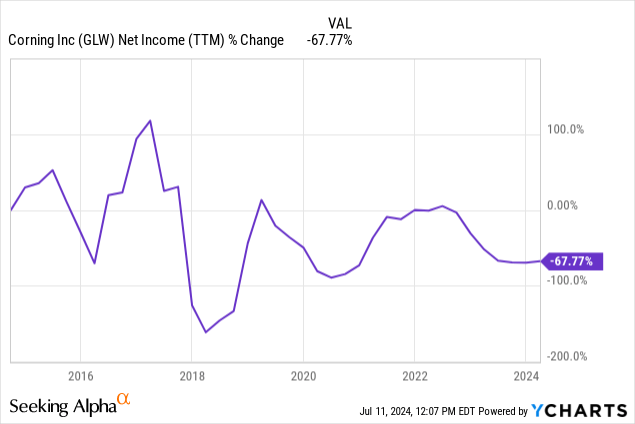
Net Income has been down -67% during the past decade and trending flat-to-down.
So, there is no real sign in the numbers yet that data center fiber demand (or anything else) will be strong enough to justify GLW’s current stock price increase.
Trading Vs. Investing Time Frames
On November 28th, 2023 I wrote a bearish article on Corning titled “Corning: Stock Price Decline Is Justified.” I was only the second bearish article published on Corning this decade on Seeking Alpha. Since that article, Corning’s stock price has gone straight up.
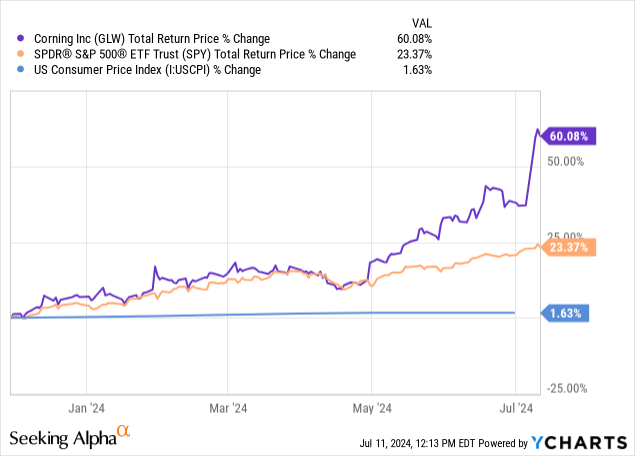
The initial bounce, where the stock more-or-less traded in line with the S&P 500, I think was pretty normal. Corning had at least appeared to stop its earnings declines and stabilize those two quarters. It’s the big move since the end of April I think is a pretty clear sign of an AI bubble. I actually think one could justify Nvidia’s (NVDA) stock move during this time because they are making a lot more money than expected. We don’t know how long that will last, but at least the numbers are there. I for this reason, I categorize Nvidia’s stock move as more of a cyclical boom than a bubble. Corning’s stock move is more bubble-like.
Let’s start by looking at a FAST Graph I posted in my previous article so we can see what analysts were expecting from earnings this year.
FAST Graphs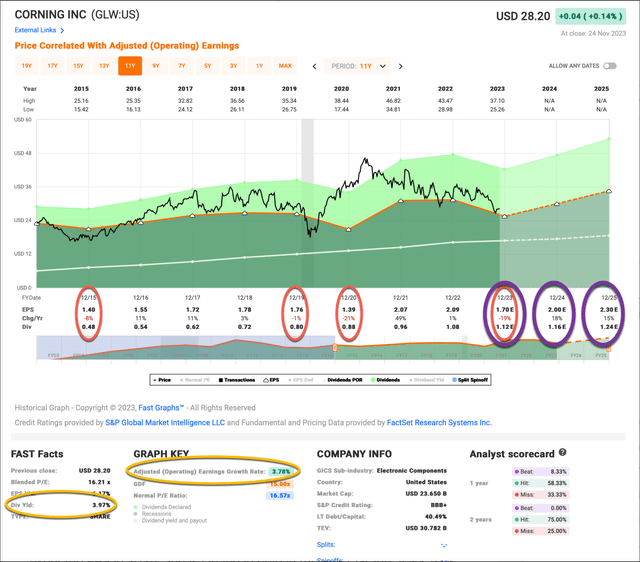
This is a FAST Graph I posted last November. I have added 3 purple circles to highlight analysts’ earnings per share expectations. For 2022 they expected $1.70 per share, 2024 $2.00 per share, and 2025 $2.30 per share.
FAST Graphs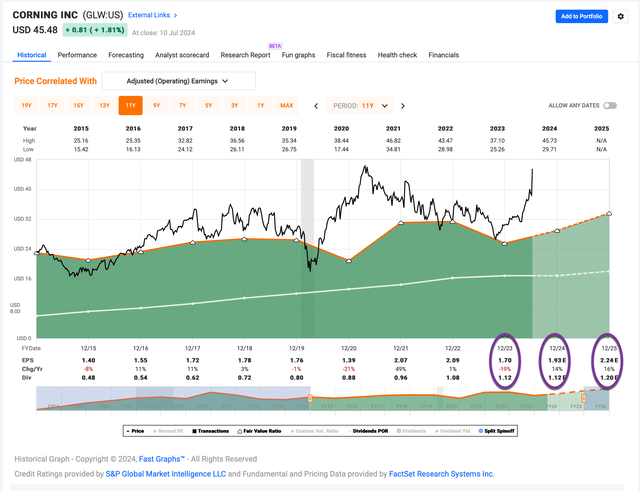
One might think that a stock price appreciation of 60% in 7 months would be a sign that future earnings growth expectations might have improved. However, Corning hit 2023 EPS on the dot at $1.70, fell from $2.00 to $1.93 for 2024, and fell from $2.30 to $2.24 for 2025. Earnings expectations have gotten worse all while the stock price rallied.
We have seen this sort of thing twice before. Once was in 1999 and 2000, a peak from which the stock has yet to recover more than two decades later, and in later 2020 into Q1 of 2021 during the Meme, SPAC, IPO, everything bubble coming out of the pandemic. The 2021 rally, of course, didn’t last, as eventually Corning’s earnings reverted to the long-term historical trend.
It’s at this point, that one needs to understand the difference between trading and investing. It’s undeniable that GLW has been a good bullish trade over the past six months, just as it was in late 2020 and early 2021, and in 1999/2000. Investors who use fundamental valuations must use a longer timeframe, however, than traders do. Fundamentals are not very predictive over the short term, and only gain correlation with the stock price over time. I have found that if I use 10 years of earnings projections, then usually within 5 years we see signs of the stock price gravitating toward the earnings trend. It can certainly happen sooner than that, but 1 or 2 years isn’t enough to declare the thesis invalid. It has taken about 5 years for my bearish Nike (NKE) thesis from 2019 to play out. The same can be said of my Estée Lauder (EL) bearish thesis. But over the long term, stock prices follow future earnings, and what investors paid for those future earnings.
All of this is important, but equally important is the data one chooses to use to project out earnings and how far one projects those earnings out. I typically use earnings data from the previous economic cycle as my starting point for projecting future earnings. I’ve found this works well about 80% of the time. Many analysts, however, use current forward earnings or recent trailing earnings and project those out longer term. I don’t think this is the best way to project medium and long-term earnings, but usually, that’s how the market operates. The flaw with this short-term approach is that there can be temporary dips and bumps in earnings that are unlikely to be sustainable in either direction, so they shouldn’t be extrapolated out longer-term.
Obviously, since the price has rocketed higher and earnings growth is expected to be the same or worse than it was since last November, my position on this stock as an “avoid” remains the same now as it was then. However, I’ve found it’s a good practice to at least try to see things from the bullish perspective when I can.
What is the market thinking?
I perform a valuation analyses on about 50 stocks per week, plus any stocks that members of my Investing Group, The Cyclical Investor’s Club, inquire about. This means that I get a pretty good read on the valuation the market is putting on the S&P 500 stocks. I express my earnings-based valuations in terms of a 10-year expected earnings CAGR, and I do this for all the less-cyclical S&P 500 stocks for which I have enough data. Usually, that’s a little over half the S&P 500, which is about 2/3rds the weighting of the S&P 500.
For the past couple of years, the market has been valuing the S&P 500 around a 5.5% 10-year earnings CAGR, give or take about 25 basis points higher or lower. Since I know that’s roughly where the market is, it can sometimes be helpful to utilize that information in reverse if my valuation comes in far away from that 5.5% 10-year CAGR level.
Currently, my 10-year earnings CAGR for GLW is about +3.03% because I think they will probably barely be able to grow earnings at all based on the past decade. My earnings growth rate estimate is about 0.49%. This might be a little low if we have higher than average inflation and GLW can pass it on to customers, since from 2015-2020 there wasn’t much inflation and part of my future estimate is based on that historical period. So, my question is: Why is the market willing to pay more for this stock right now?
Other than the AI narrative, which can serve as a sentiment catalyst, the other reason is that earnings are expected to grow at 14% this year. If I took that 14% earnings growth rate and extrapolated it out 10 years, I get a 10-year earnings CAGR of +5.73%. This is right in line with the market average. So, I think to the degree the market is using fundamentals to value the stock, what the market is doing is simply taking the short-term earnings growth estimate and assuming this level of growth can go on for the next decade. This is likely the error the market is making with the current price of the stock.
Conclusion
As I noted earlier, I track hundreds of stocks and have written hundreds of valuation articles over the years. About 80% of the time, with the addition of a few control factors, historical earnings trends are a good guide to the future, and over 3–5 years, valuations tend to adjust to earnings for most stocks. This does mean that 20% of the time, the historical trend is broken, and earnings come in much stronger than expected.
This happened to me with my Palo Alto (PANW) stock sell rating on 1/9/2023. It looked like earnings growth was slowing, and the stock price could re-rate as a result. Then, instead of earnings growing the expected 35% in 2023, they grew 76%, completely blowing expectations out of the water. Here is what the stock did after my sell article:
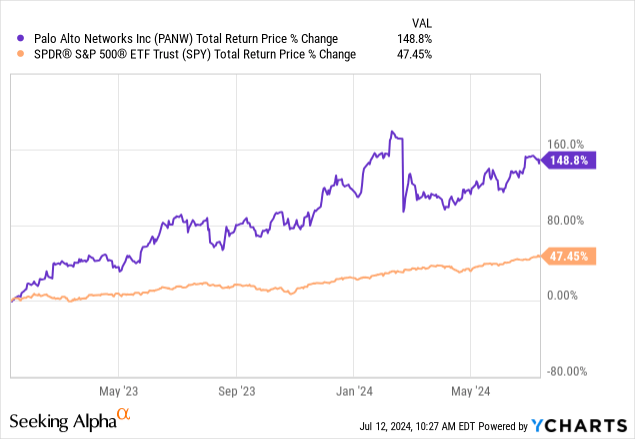
So, there are times when businesses’ earnings can surprise, and then they can maintain them going forward. However, this is the exception, and I don’t think Corning stock has the same capability to back up the recent stock price move with a similar earnings move. For these reasons, for investors, I maintain my sell rating on GLW over the medium 2-5 year time frame.
Read the full article here


Leave a Reply