Introduction
The Vanguard Consumer Discretionary Index Fund ETF Shares (NYSEARCA:VCR) could be an excellent choice for anyone looking to start or continue building a diversified portfolio. If you’ve followed some of my analyses, you probably know that I like to begin with an MSCI World composition and accumulate specific sector ETFs whenever the timing is favorable from a macroeconomic, fundamental, and technical standpoint. Whenever a specific thematic or geographic ETF presents a strong alpha outside my core portfolio strategy, I take the opportunity to overweight this segment with the passive fund. Currently, the discretionary segment represents about 10% of my portfolio, aligning with the MSCI World. Now I believe that in the U.S., the consumer discretionary sector could offer a promising alpha to capture.
Why VCR
The expense ratio is good; let’s start with that. The TER (Total Expense Ratio) of this ETF is 0.10%. While it may not be the lowest on the market, compared to its peers, the difference is minimal, to be completely honest. Similarly, there isn’t a significant difference in performance. By looking at the Seeking Alpha peers page dedicated to this ETF, it’s easy to see this.
VCR Peers (Seeking Alpha)
So, it makes sense to draw a parallel with the Fidelity MSCI Consumer Discretionary Index ETF (FDIS), which has an expense ratio of 0.08%-a very low rate (perhaps even too low).
VCR Peers (Seeking Alpha)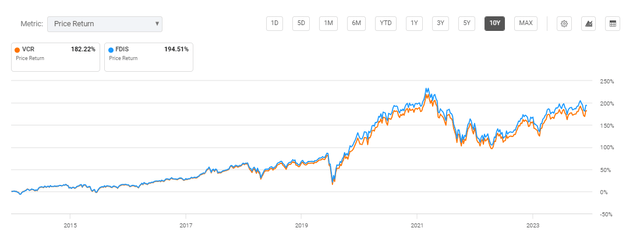
In terms of performance, FDIS has indeed shown a greater price return than VCR. There is a spread of 12.9% in the 10-year performance between these two ETFs. This difference can be attributed to the broader diversification of VCR (305 holdings versus 274 for FDIS) and Vanguard’s approach to structuring the ETF through full replication, which typically results in higher costs compared to the sampling method used by FDIS.
An Interesting ETF Composition
The ETF has a fascinating composition. First, I’d like to highlight something that might seem basic, but it’s the starting point of my analysis: VCR is heavily oriented toward the U.S. market, with about 95% of its holdings in U.S. stocks. With that in mind, according to the ETF’s official webpage, 14.50% of its holdings are in the Automotive Parts & Equipment segment; this is the second-largest thematic holding. The Broadline Retail segment, which in my opinion is closer to consumer staples than consumer discretionary, also makes up a significant portion. Following these two, there is a 10% allocation in the Restaurant segment. This passive fund is exposed to two segments that historically tend to perform with a negative correlation, providing stability while also offering positive growth prospects. Indeed, the fund’s beta relative to the Dow Jones U.S. Total Stock Market Index is around 1.25.
The top 10 holdings in the VCR ETF represent 56.43% of the fund. While this concentration might seem a bit high to me, it’s in line with how consumer discretionary benchmarks are typically structured, largely depending on the capitalization of the stocks in the index.
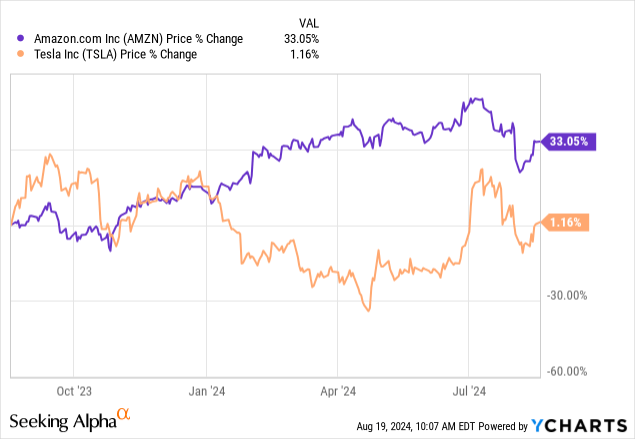
Among these top 10 holdings are Amazon, which represents the Broadline Retail segment, and Tesla, which leads the automotive sector. The recent decoupling of these two segments, in my opinion, is quite fascinating.
Why Choose a Consumer Discretionary U.S. ETF?
There are a few reasons, and I’m now trying to categorize them into three types of motivations.
From A Macro Point of View
The recent downtrend in consumer discretionary stock prices is largely due to the growing fear of a recession. However, as this fear recedes, much of the monthly losses are being recovered. Looking at the most recent macroeconomic data, the situation is not as bad as it might seem. Firstly, the Consumer Price Index (CPI) reading for July 2024 shows an annual increase of 2.9%. It’s important to note that five-year inflation expectations also remained unchanged at 3.0%, according to the Survey of Consumer Expectations. The latest reading of the core inflation rate in the United States, published on August 14, 2024, indicates an annual increase of 3.2%. Additionally, the latest Non-Manufacturing ISM Report On Business for July 2024 shows that the Services PMI stood at 51.4, signaling an expansion in the services sector. Furthermore, the latest U.S. retail sales report for July 2024 shows a 1% increase compared to the previous month, exceeding analysts’ expectations of a more modest 0.3% rise. To sum up, it’s very likely that in September, the Federal Reserve will decrease interest rates, and the possibility of a soft landing cannot be ruled out. Indeed, this could be a scenario where the consumer discretionary sector does not contract as much as the market currently anticipates, judging by the recent price declines.
From A Fundamental Point of View
The largest drawdown in the market was observed in the U.S. segment, coinciding with the Q2 reporting season. However, this is not justified by a downgrade in earnings or the profitability outlook of companies. The latest FactSet report is particularly interesting. It shows that the earnings growth rate for the S&P 500 was 10.8% year-over-year, marking the highest growth rate since the fourth quarter of 2021. Notably, 78% of S&P 500 companies reported earnings that exceeded analysts’ expectations, with revenues growing by 5.2% year-over-year. Therefore, overall, there are no significant signs of contraction-or at least not of a magnitude that justifies the recent market drawdown.
S&P 500 Revenue Growth (YoY) (FactSet)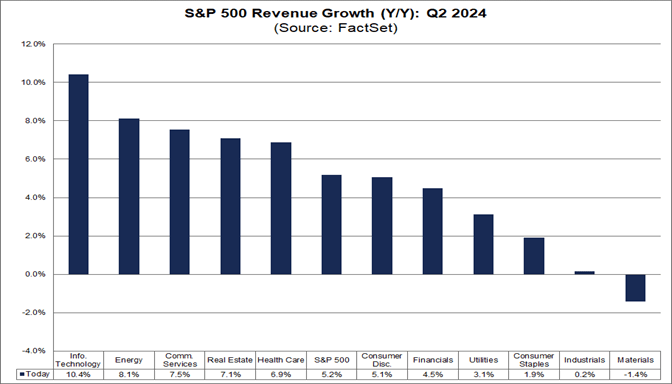
And more specifically, the average year-over-year revenue growth in the consumer discretionary segment is positive, around 5.1%.
From A Technical Point of View
As I always emphasize whenever I introduce a technical point of view into my analysis, I use charts solely to identify statistically favorable moments to invest in a sector. In my humble opinion, it is a mistake to base an investment decision solely on a chart’s overview.
That said, the RSI 21 on the daily chart reached a historical low in August, which usually indicates a good entry point for investment.
VCR, RXI, 1D (TradingView)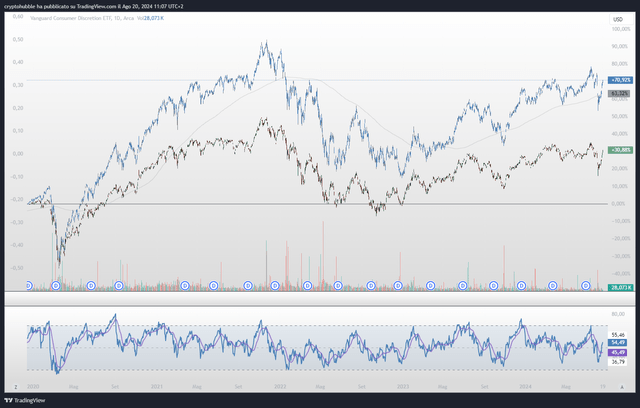
Looking at the 1-week time frame, it is easy to see that there was a strong reaction to the 200-week moving average.
VCR, RXI, 1W (VCR, RXI, 1D)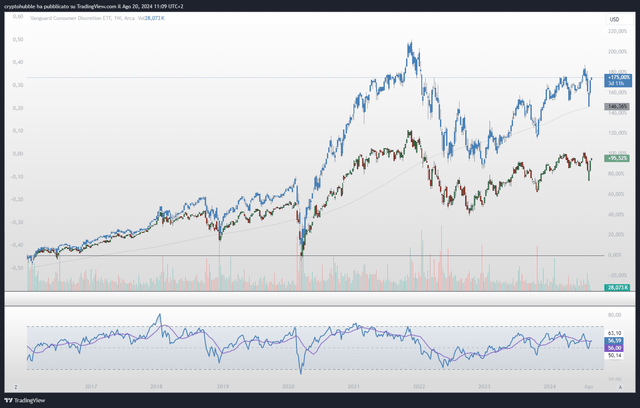
The blue candlestick chart represents VCR, while the green-red candlestick chart represents the iShares Global Consumer Discretionary ETF (RXI), a BlackRock fund designed to give investors exposure to the consumer discretionary stock segment. I compared these two to illustrate how the spread between them has increased over the last decade.
What could go wrong?
A recession could naturally impact the revenue of the consumer discretionary segment, though this isn’t always the case historically. When considering a recession, it might seem logical to orient a portfolio more toward consumer staples, as families might reduce their spending on discretionary items. During a crisis or recession, both the S&P 500 and its consumer discretionary component typically decline. However, when monetary policy becomes expansionary, consumer discretionary stocks tend to outperform the S&P 500. This comparison with SPDR® S&P 500® ETF Trust (SPY) during the 2008 financial crisis illustrates this pattern.
VCR, RXI, 1W, 2008 (TradingView)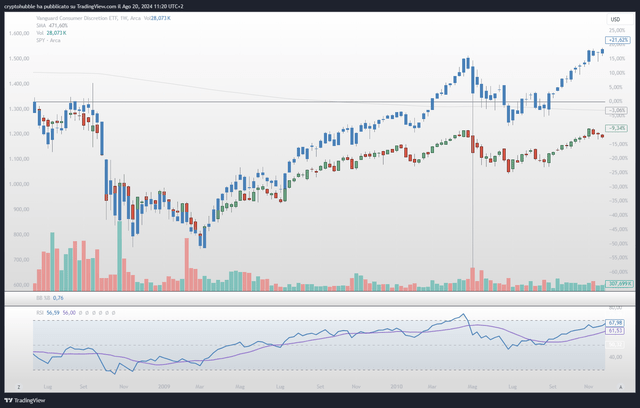
Conclusion
I believe that VCR could offer a solid alpha compared to the S&P 500 for the remainder of 2024 and beyond, which is why I would like to reaffirm a HOLD rating. In my opinion, the market has overstated the fear of a recession, and the recent economic data, along with the stock price recovery, reflect this.
Read the full article here


Leave a Reply